(635c) Towards Gene-Correlated Live-Cell Spatial Metabolomics with Fingerprint Raman Microscopy | AIChE

(635c) Towards Gene-Correlated Live-Cell Spatial Metabolomics with Fingerprint Raman Microscopy

Authors 

Cicerone, M. T., National Institute of Standards and Technology
Chen, W. W., Georgia Institute of Technology
Qiu, P., Georgia Institute of Technology
Raman spectroscopy has long been known to provide sufficient information to discriminate distinct cell phenotypes. Underlying this discriminating capability is that Raman spectra provide an overall readout of the metabolic profiles that change with transcriptomic activity. Robustly associating Raman spectral changes with the regulation of specific signaling pathways may be possible, but the spectral signals of interest may be weak and vary somewhat among individuals. Establishing a Raman-to-transcriptome mapping will thus require tightly controlled and easily manipulated biological systems and high-throughput spectral acquisition. We attempt to meet these requirements using Broadband Coherent Anti-Stokes Raman scattering (BCARS) microscopy to spatio-spectrally map the C. elegans hermaphrodite gonad in vivo at subcellular resolution. The C. elegans hermaphrodite gonad is an ideal model system with a sequential, continuous process of highly regulated spatiotemporal cellular events. We demonstrate that the BCARS spatio-spectral signatures correlate with gene expression profiles in the gonad, evincing that BCARS has potential as a spatially-resolved -omics surrogate.

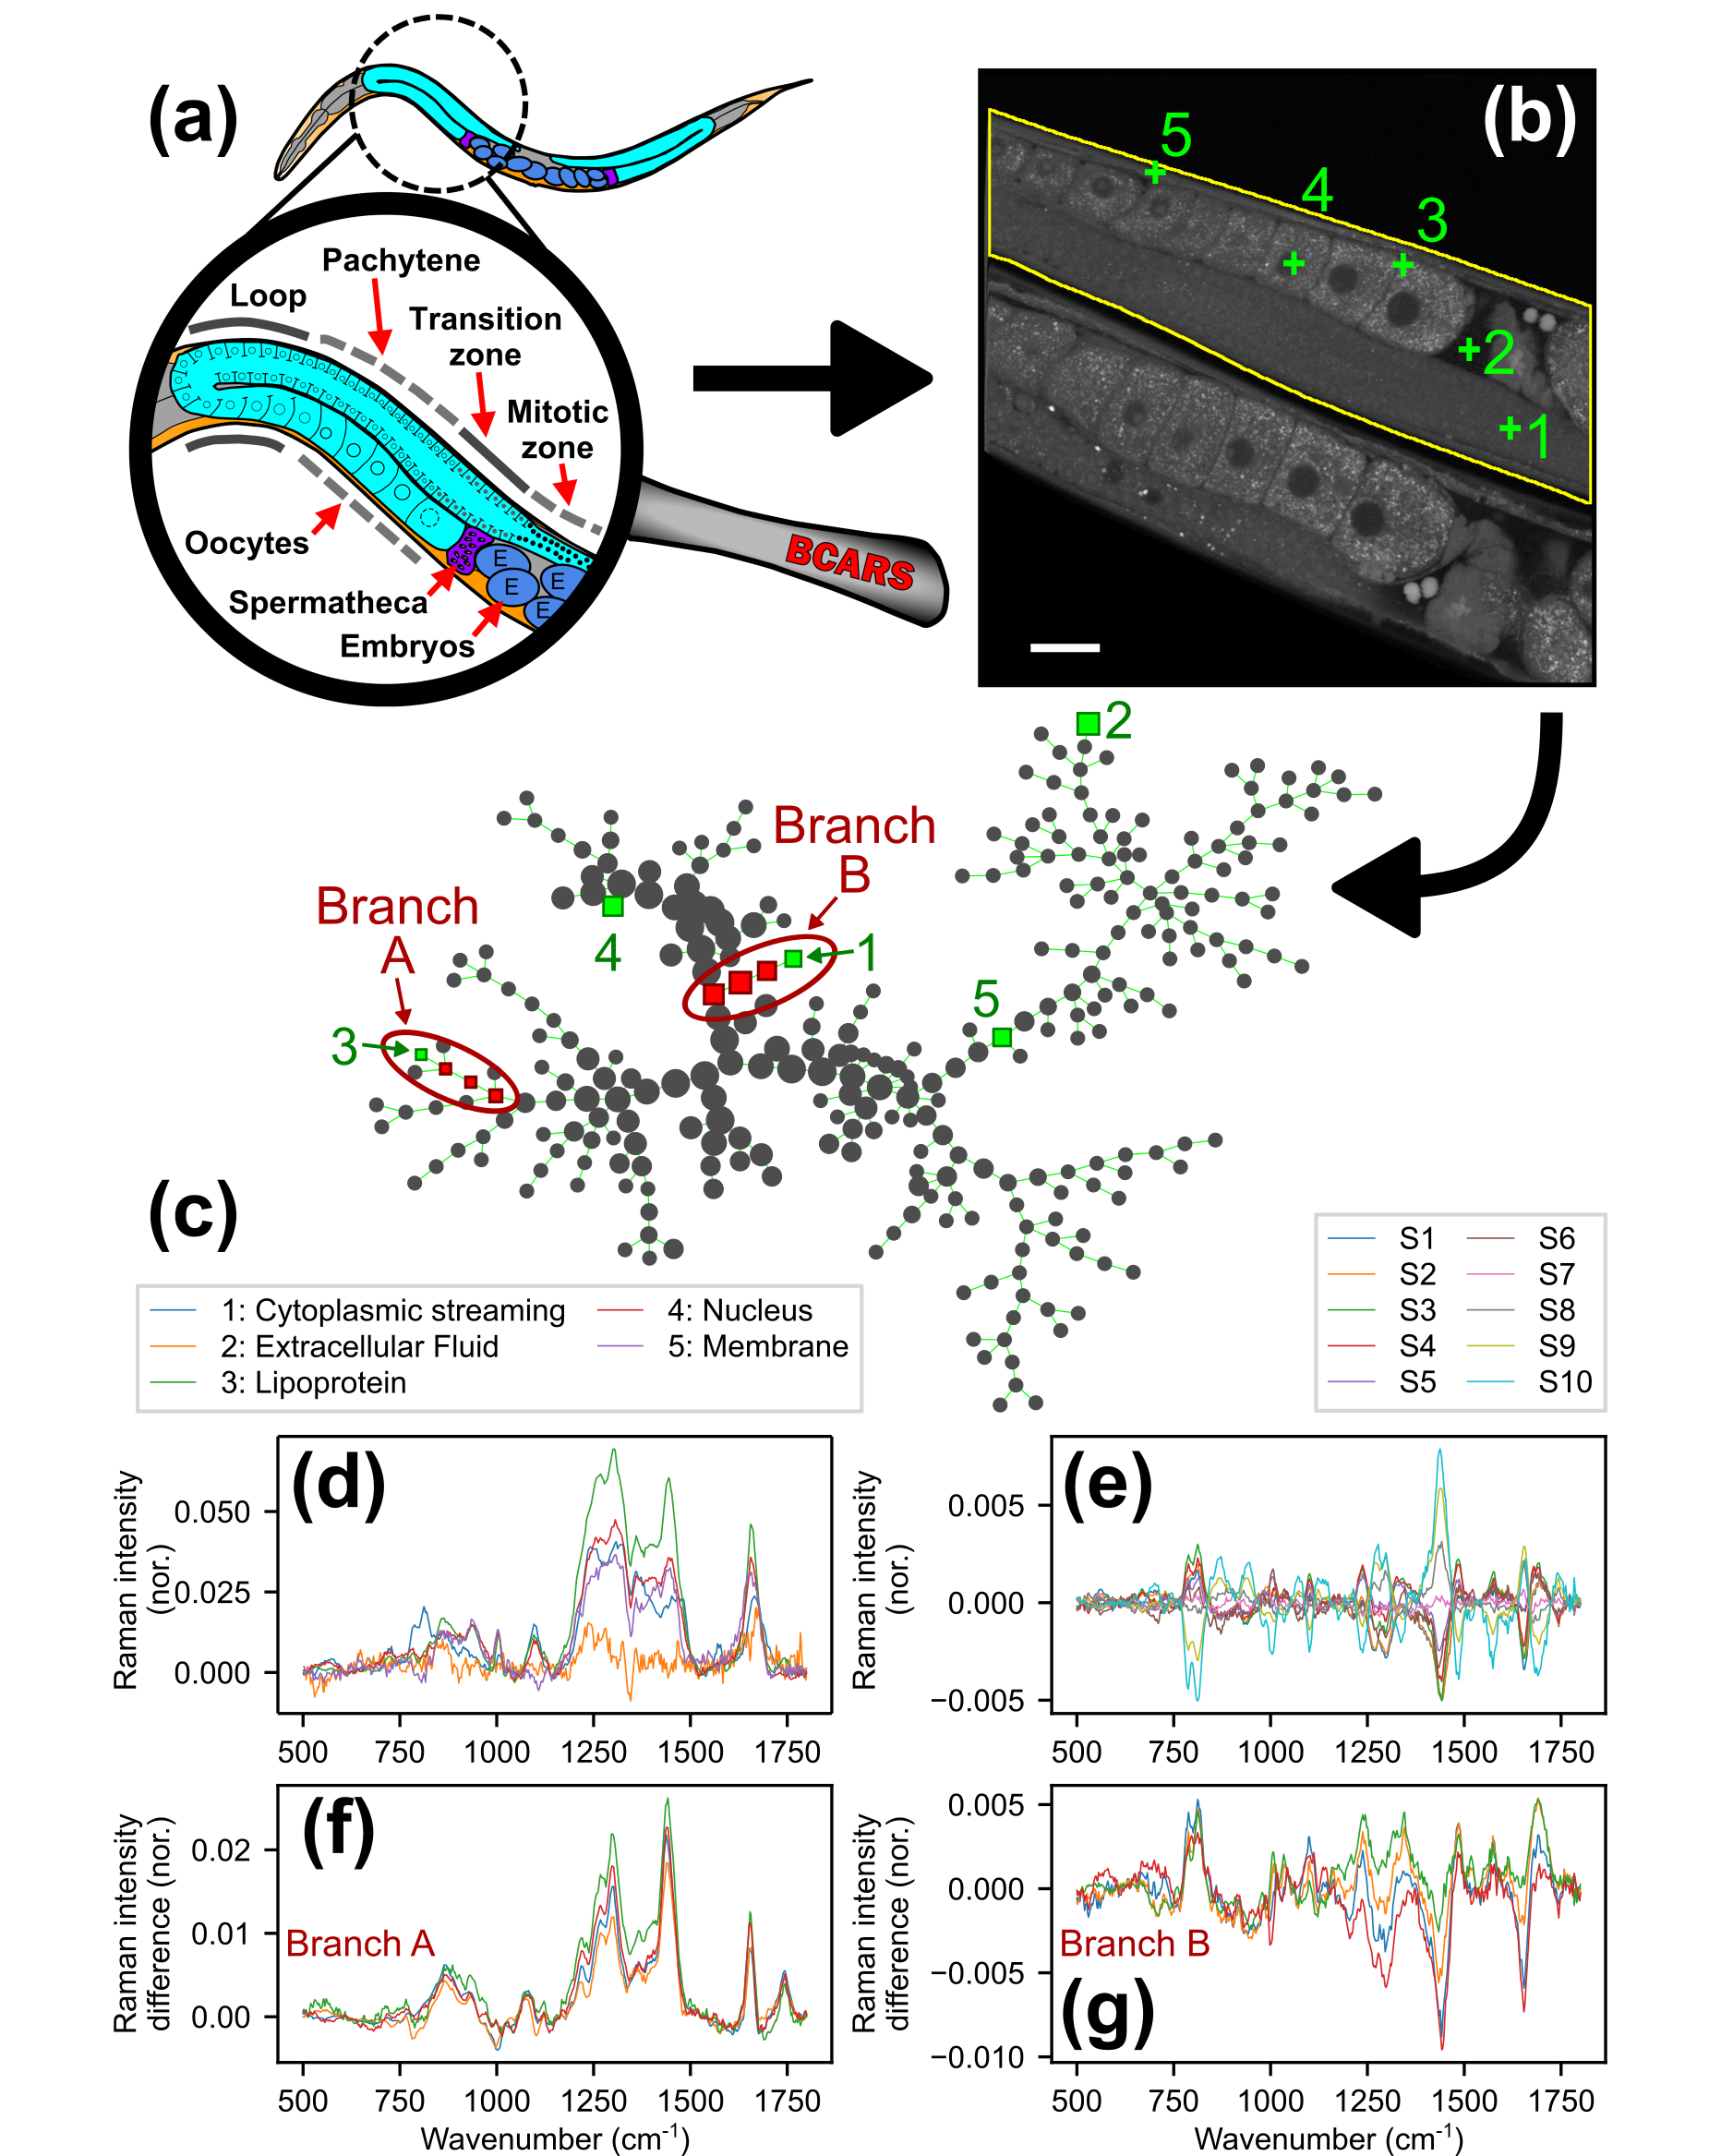
Figure: BCARS imaging of C. elegans gonad and SPADE (Spanning-tree Progression Analysis of Density-normalized Events) analysis. (a) Schematic drawing of a C. elegans hermaphrodite reproductive system. (b) 2925 cm−1 BCARS image of two wild-type adult worms. The yellow line indicates the outline of the upper worm (“Up”). Scale bar, 20 μm. (c) SPADE tree representation of fingerprint BCARS spectra from the outlined area. The pixels 1-5 shown in (b) belong to the indicated nodes on the SPADE tree. (d) BCARS spectra corresponding to the 5 pixels, with their identities labelled in the legend. (e) Spatially-averaged difference spectra of 10 linear gonad sections of Up, with the mean spectrum of the entire Up gonad being subtracted. (f,g) Difference spectra corresponding to each node in branches A and B (respectively) labelled in (c). The mean spectrum of the full Up worm is subtracted. Note that the difference spectra are similar within a branch, but completely different across branches.