Share your tips, on Engage!
Do you have some tips of your own about spreadsheets? If you're a member, I'd love you to share them on AIChE Engage.
Once chemical engineers develop a spreadsheet calculation, however large or small in scale, they are typically interested in running case studies. Case studies can produce results for variations in input values. Engineers very often do this manually, by copying-and-pasting calculation results into an adjacent table and then generating charts to depict the relationships. However, there is a better way.
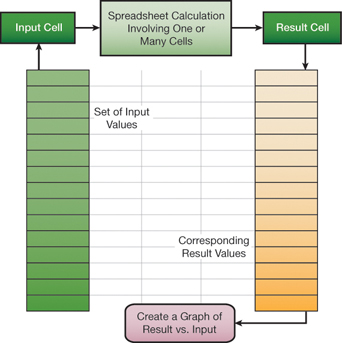
Below, we illustrate the application of Excel’s Data Table tool for a “one-way” case study. A set of input values is mapped into an input cell, and the corresponding values from a result cell are tabulated. This feature is live on the spreadsheet and is implemented with Excel’s TABLE array function.

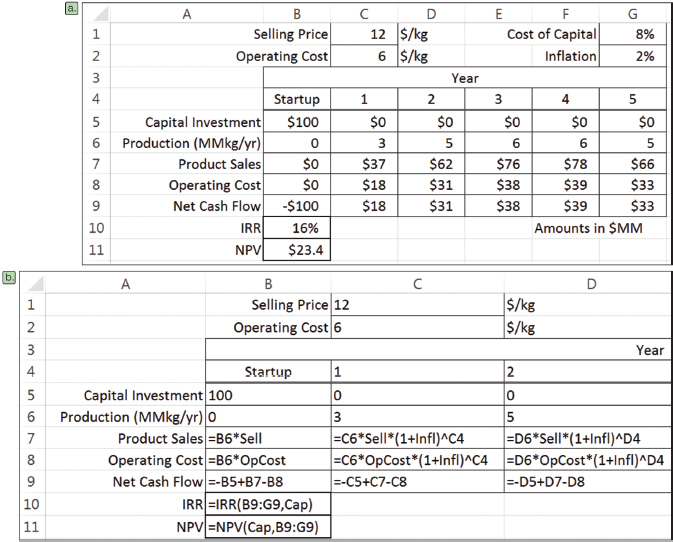
We can use the Data Table tool to study the cash flow table (a) below. In this example, the internal rate of return (IRR) and net present value (NPV) are calculated based on net cash flows in years 0 through 5. The underlying formulas for the first several columns are shown in (b) below; the rest follow the established pattern.

To carry out a case study of IRR versus selling price, we set up a column of candidate selling prices and a pointer formula to IRR in the adjacent column, one row up from the selling prices (see below). Then, by invoking the Data Table command from the What-If Analysis drop-down list in the Data Tools group of the Data tab of the Ribbon, and identifying the Column Input cell as the Selling Price (named Sell), we can flesh out the table.

This is a live case study, so when another parameter, such as the inflation rate, is changed, the values update automatically.
The Data Table feature also allows for two-way case studies. To construct a two-way case study, place a column of values for one input parameter on the left of the table and a row of values for a second input parameter in the top row of the table. Then, place the pointer formula, or rule, in the empty cell in the upper left-hand corner of the table.
Excel’s Data Table is a convenient, efficient tool for carrying out case studies using spreadsheets as a calculation engine. Several case studies can be adjoined to a spreadsheet calculation, anticipating questions that might arise about the sensitivity of results to changes in input parameter values. Take advantage of Data Tables!
More tips and techniques
If you're just joining us, check out the entire series. And if you want a full crash course instead of just helpful tips, you should check out the AIChE Academy's "Spreadsheet Problem-Solving for Chemical Engineers," where these tips come from, and also check out the other Excel courses available through the AIChE Academy at www.aiche.org/academy.
Want more Excel tips for chemical engineers?
If you know you want to delve even deeper than this blog series – or if our Excel tips leave you hungry for more – be sure to check out AIChE’s virtual combo course on spreadsheet problem solving and VBA programming. It’s taught by David E. Clough, the author of this series, and combines two of AIChE’s most popular spreadsheet courses, Spreadsheet Problem-Solving for Chemical Engineers and Excel VBA Programming for Chemical Engineers.
Share your tips, on Engage!
Do you have some tips of your own about spreadsheets? If you're a member, I'd love you to share them on AIChE Engage.
This Excel spreadsheet series is drawn from an article by David Clough that appeared in AIChE's CEP Magazine. You can find the current issue and an extensive archives of back issues at www.aiche.org/cep.


