
Spreadsheet software can be used to build integrated process and economic models that provide new insights into profitability.
Techno-economic modeling (TEM) connects research and development (R&D), engineering, and business. By linking process parameters to financial metrics, it can help businesses better understand the factors that affect the profitability of their technology development projects.
TEM is useful throughout the technology development lifecycle. When considering new ideas, innovators can use the technique to assess economic feasibility and potential. At the bench scale, scientists can use it to identify the process parameters that have the greatest effect on profitability. During process development, engineers can use TEM to compare the financial impact of different process conditions and configurations. TEM incorporates information from all of these stages of development, and offers a basis for making objective decisions.
The individual techniques used in TEM, which include process modeling, equipment sizing, and economic calculations (1–3), are already familiar to chemical engineers. This article demonstrates how to integrate and leverage them in a single, holistic model by building a techno-economic model for the fictional ABCD chemical process, which consists of four unit operations centered on a gas-phase catalytic reaction.
TEM method overview
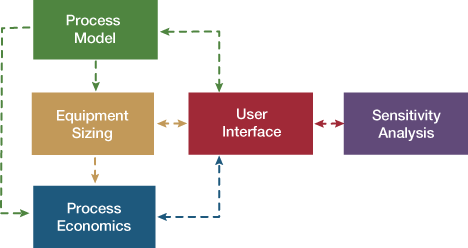
▲Figure 1. Basic structure and data flow for a spreadsheet techno-economic model.
To build a techno-economic model, you must first develop a process model and calculate equipment-sizing parameters, then estimate capital and operating costs, and finally build a user interface. The process model generates a stream table, which is the foundation of the techno-economic model. Information from the stream table is used in equipment sizing calculations to derive parameters necessary for estimating capital and operating costs. The user interface consolidates important input and results on a single sheet, facilitating model operation and sensitivity analysis. Figure 1 shows how these components are interconnected.
Software platform. The two most common platforms for TEM are spreadsheet software and process simulation software. While each has its own benefits, this article focuses on using spreadsheet software. Spreadsheet models are flexible and do not require specialized software, so they are ideal for early-stage companies and technologies. Process simulation tends to be less accessible and to require a greater degree of certainty in process parameters and configuration, so it is generally more appropriate for later-stage projects and more-complex systems.
Model behavior. In a techno-economic model, financial metrics are connected to process and economic parameters through a network of correlations. Automating these connections makes a model more usable and efficient. Consider how tedious it would be to collect sensitivity analysis data from a model that required you to manually enter values from equipment cost curves. In most cases, by carefully choosing methods and assumptions, you can minimize or eliminate the need for that type of manual intervention.
Accuracy. Capital cost estimates are often divided into five classifications based on accuracy (1):
- order-of-magnitude estimate (accuracy > ±30%)
- study estimate (accuracy ±30%)
- preliminary estimate (accuracy ±20%)
- definitive estimate (accuracy ±10%)
- detailed estimate (accuracy ±5%).
For TEM, capital cost estimates should be detailed enough to respond to changes in process parameters. However, if your estimation method is too detailed, you will have difficulty automating it. Order-of-magnitude estimates are generally not detailed enough, since they do not consider individual equipment characteristics. Preliminary, definitive, and detailed estimates are typically too detailed. Study estimates are best suited for TEM, since they account for the characteristics of individual pieces of equipment, while still allowing for automated calculation.
To develop a study estimate, first estimate major equipment costs and then apply multiplying factors to estimate total capital cost. Study estimates are also called major equipment estimates or factored estimates.
Modular structure. This article presents a modular approach to TEM. Much like in computer programming, each section or module accepts input from the user or from other sections and processes it into results for use elsewhere. The individual modules are easier to understand and error check, and, once they are built, they can be reused in future models. The screenshots in this article provide examples of how to accomplish this in a spreadsheet.
Process model
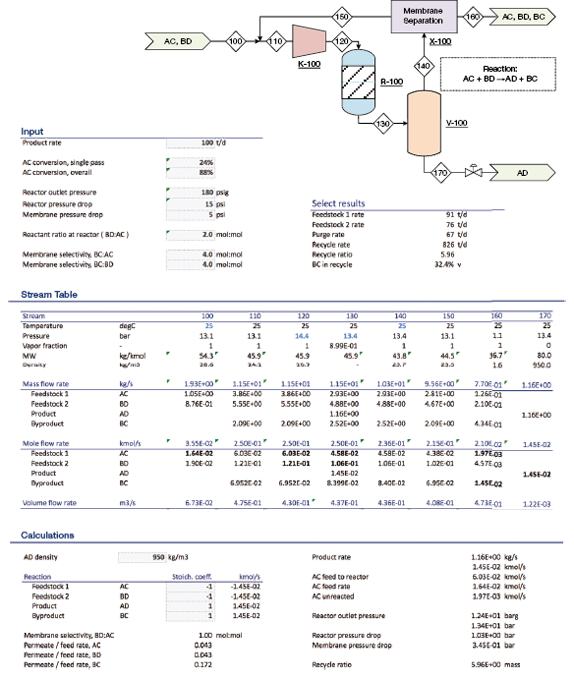
▲Figure 2. In the ABCD process, gaseous feedstocks AC and BD react catalytically to form liquid product AD. A membrane separation unit selectively removes byproduct BC from the recycle stream.
Start your techno-economic model by developing a process model. The process model calculates stream properties used to estimate equipment sizes and costs, and typically consists of a process flow diagram, user input, calculations, and a stream table. Figure 2 shows a process model for the ABCD process.
Process flow diagram. The process flow diagram illustrates the chemical process being modeled. The new technology being evaluated might be the process itself, or it might be just one component of the process. Label all major equipment, process streams, and major utilities so they can be easily referenced. Also, include an image of the process flow diagram with the model for clarity and convenient viewing.
User input. Take extra time to identify the most appropriate user input parameters, including those that are important in other parts of your organization. For example, if business managers consider capacity in terms of product rate, do not base the model on feedstock rate. Clearly label and consolidate all user input at the top of the sheet.
Stream table. Catalog the important characteristics of each process stream in a stream table. You can perform simple material balance calculations directly within the stream table, but more complex calculations should be performed in the calculations section.
Calculations. A clearly separated calculations section reduces troubleshooting time and complexity. In general, calculations should be efficient, easy for others to understand, and fast to debug. As a first step, always convert user input to a coherent system of measurement. This section could include calculations related to chemical reactions, pressure drop, electrochemistry, and density.
Equipment sizing
To estimate equipment and utility costs, you first need to perform some equipment-sizing calculations using data from the stream table. To estimate equipment costs, calculate capacity parameters appropriate for each piece of equipment. Capacity parameters are quantitative equipment characteristics that are directly related to purchased cost. Table 1 lists typical capacity parameters and utilities for several types of equipment.
| Table 1. Typical capacity parameters and utilities for various types of equipment. | ||
| Equipment Type | Capacity Parameter | Utilities |
| Pump,... | ||
Would you like to access the complete CEP Article?
No problem. You just have to complete the following steps.
You have completed 0 of 2 steps.
-
Log in
You must be logged in to view this content. Log in now.
-
AIChE Membership
You must be an AIChE member to view this article. Join now.
Copyright Permissions
Would you like to reuse content from CEP Magazine? It’s easy to request permission to reuse content. Simply click here to connect instantly to licensing services, where you can choose from a list of options regarding how you would like to reuse the desired content and complete the transaction.