
Process hazard analysis (PHA) is a key component of process safety management (PSM). This article presents a technique that incorporates the visual approach of the bowtie model into hazard and operability (HAZOP) analysis.
As one of the most widely used and respected process hazard analysis (PHA) techniques, hazard and operability (HAZOP) studies provide systematic rigor in challenging the design and operation of a new, modified, or established facility. This method to study processes and operations provides a foundation for further analysis and risk assessment.
A HAZOP study (often referred to as “a HAZOP”) is a structured, text-orientated technique that identifies potential hazards and operability problems in a defined system. A bowtie analysis provides a clear graphical representation of hazard scenarios to illustrate the threats that stimulate a hazardous event, the consequences of that event, and the barriers that mitigate its impact or prevent it from occurring altogether. Common practice treats a HAZOP as a deductive approach to systematically identify hazardous scenarios, whereas a bowtie analysis enables engineers to visualize scenarios that have already been identified — i.e., they enhance a HAZOP. Bowties can be used for hazard identification (to replace HAZOP studies) and can serve as useful visual and evaluative aids.
The common practices of a HAZOP analysis as a PHA methodology that we currently use have changed very little since the method was conceived in the 1960s by Imperial Chemical Industries (ICI) and discussed by H. G. Lawley in a 1974 CEP article (1). A typical approach to a HAZOP is documented in an international standard set by the International Electrotechnical Commission (IEC) (2). More practical guidance is available from AIChE’s Center for Chemical Process Safety (CCPS) (3) and the Institution of Chemical Engineers (IChemE) (4).
HAZOP teams use software to record the results of their discussion in a worksheet that is displayed to all participants. Team members can view their contributions and, if necessary, correct or expand the notes.
The output of a HAZOP consists of worksheets summarizing the identified hazard scenarios. The worksheets may stand alone, or may be further developed in risk assessments, such as layer of protection analysis (LOPA), to qualify or quantify the risks associated with the hazards. Although integrated HAZOP and LOPA applications exist, their ability to convey information to those who were not present during the studies is limited.
While the HAZOP technique has proven to be an invaluable hazard identification tool, it does have its drawbacks. These have been documented (but not necessarily well publicized or acknowledged) in several books (4,5), industry magazines (6), and reports (7,8).
HAZOP limitations
Teamwork. Trevor Kletz, in his book on HAZOP and hazard analysis (HAZAN) (5), noted that, “Although HAZOP is a valuable technique, no one jumps out of bed on a Monday morning shouting, ‘Hooray! I’ve got a HAZOP today!’” Engineers recognize the benefits but often dread the effort required to plan and execute these rigorous studies.
In addition, Kletz reflects on the stale, textual nature of recording, writing, “If HAZOP studies and similar systems are not acceptable to creative minds, they will never succeed.” Regardless of the depth of hazard scenario discussions, the documentation can become monotonous and dull. If the study is poorly recorded or difficult to recall, understand, and explain, the analysis may be of little or no benefit.
Morale and fatigue are well-known phenomena that must be managed with consideration to project timescales and budgets, as well as participant continuity. Some studies take a long time, during which personnel changes may occur and the composition of the team can change. Therefore, any momentum may be lost as new members join and scenarios need to be revisited to bring everyone to the same level of understanding. Conversely, participants can experience overload if they work on a HAZOP for a long time and stare at similar text for extended periods (a study can span days or even months depending on the scale and complexity of the process). Normally this is managed by establishing a suitable study environment and taking regular breaks. Furthermore, because human brains absorb and interpret much more data from an image than from text, sessions can be more productive in the same amount of time, or less, if images are integrated into the analysis.
Safeguards. Safeguards are the existing or planned protection measures that prevent hazards from occurring or escalating, or that mitigate any consequences. These are either technical, equipment-based measures or procedural, behavior-orientated measures.
Commercial HAZOP/PHA software tools replicate the standard format for a HAZOP worksheet (2), as shown in Table 1. This format includes only a single column to document all of the prevention and mitigation measures for the cause-consequence scenario.
| Table 1. A HAZOP worksheet provides an overview of the study elements in a tabular form. The current format includes only a single column for safeguards or existing controls. | ||||||||
| Guide Word | Element | Deviation | Possible Causes | Consequenses | Safeguards | Comments | Actions Required | Action Allocated To |
| No | Material A | No Material A | Supply Tank A is empty | No flow of A into reactor Explosion | None shown | Situation not acceptable | Consider installation on Tank A of a low-level alarm plus a low/low-level trip to stop Pump B | MG |
| No | Transfer A at a rate > B | No Transfer of A takes place | Pump A stopped, line blocked | Explosion | None shown | Situation not acceptable | Measurment of Material A flowrate, a low-flow alarm, and a low-flow trip to Pump B | JK |
| More | Material A | More Material A | Filling of tank from tanker when insufficient capacity exists | Tank will overflow into bounded area | None shown | Remark: This would have been identified during examination of the tank | Consider high-level alarm if not previously identified | EK |
This limitation often causes HAZOP study teams to give unwarranted credit to safeguards (6). Conversely, the team may take too little or even no credit for safeguards, most likely because the role of the safeguard was not apparent. Without a comprehensive appreciation of the risk reduction contributions made by individual safeguards, their criticality is often subjective because they are viewed in isolation, not in context with other safeguards. If the role of safeguards is not properly understood, then they may not be addressed with the proper maintenance, monitoring, and management they require.
Commonalities. The linear, tabular nature of HAZOP recording tends to focus on a single cause with one or more consequences. However, a different cause may produce the same consequence. In such cases, it is easy to simply record “as above” or “see above” without fully appreciating the common elements and subtle differences in the scenarios.
For example, the guide word “No” can be combined with the parameter “Flow” to create the deviation “No Flow.” One cause of no flow could be a valve that is closed when it should be open. This cause could create a consequence, such as overpressure, that contributes to pipe rupture. Later in the study, the guide word “More” combined with the parameter “Pressure” creates the deviation “More Pressure,” which could result from the same closed valve. Rather than repeat the closed-valve scenario, it is more efficient to record simply “as per No Flow.”
The U.K. Health and Safety Executive recognized this as a weakness in the technique. One report notes that HAZOPs focus on a single cause, which can create multiple consequences, whereas experience shows that hazardous events are created by a variety of causes that are difficult to discuss and document using a conventional HAZOP studies approach (7). Another report, from the U.K. Health and Safety Laboratory, calls this a major disadvantage of HAZOP studies. Incidents caused by multiple independent or coincident initiating events are not readily exposed or easily documented by the HAZOP method (8).
An alternative for PHA
The bowtie method of PHA represents hazard scenarios in graphical, rather than written, format. The technique is well-documented in a CCPS Concept Book (9) and also discussed in a previous CEP article (10). This approach enables the study team to maintain focus, since participants are not overwhelmed by masses of text and they can be confident that their contributions are recognized and recorded.
The extent of ineffective organizational and technical safeguards is easily visualized with proper categorization. The potential effects of system failures are more immediately recognizable in a bowtie format, and therefore easier to address.
Showing safeguards as barriers on their respective side of the top event ensures that the complete protection portfolio is represented. The team discusses and documents each scenario all the way to its conclusion and considers what recovery measures may be available or what resilience is necessary.
Restructuring
A PHA technique that we call Visual HAZOP uses bowtie analysis to overcome the disadvantages of traditional HAZOP analysis worksheets. This method combines the guide-word/deviation approach of a HAZOP with the clarity of a bowtie analysis. It ensures that suitably proportionate rigor is applied to confirm known issues and identify previously unknown problems.
The visually intuitive nature of bowties helps display the risks associated with the cause-consequence scenarios. This clarity helps study participants quickly develop hazard scenarios and also assists in recalling discussions several days or weeks later. It further enables hazards to be addressed promptly and managed successfully.
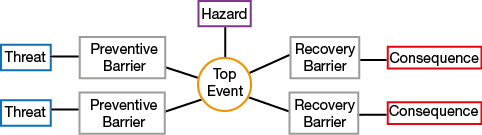
▲Figure 1. A bowtie diagram is centered about a hazard (purple) and a top event (orange), which causes the hazard to be realized. The top event may be caused by many different threats (blue), which are prevented from escalating by barriers (gray). The effects of the top event can be mitigated by risk-reduction measures (gray) before the consequences (red) occur.
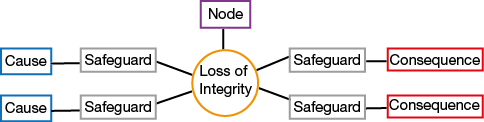
▲Figure 2. Terminology used in a bowtie PHA can be altered to be consistent with HAZOP terminology.
The bowtie visual PHA diagram (Figure 1) is read from left to right and is centered about a hazard (i.e., something with the potential to cause harm) and an event (known as the top event) that causes the hazard to be realized. The top event may be caused by many different threats that can be prevented from escalating by risk controls in the form of barriers (i.e., technical or organizational measures). The effects of the top event can be mitigated by risk reduction measures before the consequences occur. This terminology used in a bowtie analysis can be revised to be consistent with HAZOP terminology (Figure 2).
However, simply changing the terminology is not sufficient, for several reasons:
- it is not clear which deviations the cause and consequence relate to
- it is not obvious which cause enables which consequence
- a HAZOP node may have several different hazards associated with it.
To address these shortcomings, suitable software and an efficient HAZOP scribe are required. Microsoft Office (either as Excel or Word) is arguably the most common HAZOP recording tool. However, it does not offer the reporting, analysis, and action management power of the commercially available PHA tools. Similarly, conventional drawing, drafting, or presentation tools can create bowties, but they have little or no analytical functionality.
A HAZOP identifies deviations from the intended design by combining guide words (e.g., No, More, Less) and parameters (e.g., Flow, Pressure Temperature). The deviations and possible causes are documented on a bowtie as threats. For each cause/threat, appropriate safeguards that can prevent a loss of integrity (e.g., containment or control) are documented as barriers. Consequences associated with that cause/threat are recorded together with appropriate recovery measures following the loss of integrity — these recovery measures are also displayed as barriers.
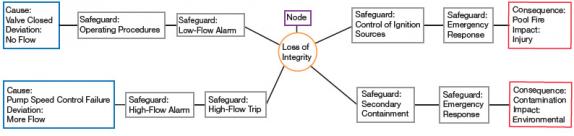
The conventional HAZOP process continues as each deviation is discussed and added to the bowtie diagram. If a previously mentioned cause arises during discussions of another deviation, that cause is recorded as the same threat but can be annotated with another deviation (e.g., a closed valve can cause no flow and also more pressure upstream or less pressure downstream). Figure 3 is a sample HAZOP bowtie diagram of such a study.
▲Figure 3. As the bowtie diagram is developed, the relationships between the components are displayed and can be analyzed during or after the study meeting. Bowties are most effective when safeguards are separated into prevention and mitigation measures.
Deviations that are deemed not applicable, causes that are considered not credible, and consequences that are judged not significant should be recorded as such for complete documentation.
As the bowtie diagram is developed, the relationships between the components are displayed and can be analyzed during or after the study meeting.
Bowties are most effective when safeguards are separated into prevention and mitigation measures. When HAZOP worksheets are converted into a visual PHA using bowties, any discrepancies (such as missing safeguards overlooked by the study team, or safeguards that have been inappropriately assigned to the wrong cause or consequence) need to be revisited. This usually requires returning to the HAZOP and resuming the discussions (with the same or similar review team). A productive study session involves using bowtie visualizations while discussing and documenting scenarios to minimize errors and omissions. These discussions can simplify the scenario complexity and clarify the hazard context. An effective scribe can reduce the likelihood of misplaced or missing safeguards.
PHA example
Consider the transfer of an acid from Vessel A to Vessel B. Table 2 provides an example HAZOP worksheet for this process. The transfer activity is defined by a series of parameters (Flow, Pressure, Temperature, etc.) that are challenged with guide words (No, More, Less, etc.) to prompt the study team to propose potential causes (e.g., a No Flow deviation is caused by the pump stopped when it should be running). The consequences (i.e., loss of production) for these causes are prevented by having a safeguard (i.e., low-flow alarm).
| Table 2. A HAZOP discussion of the transfer of an acid from Vessel A to Vessel B produces a tabular worksheet. | |||
| Deviation | Cause | Consequence | Safeguards |
| No Flow | Pump stopped | Loss of production | Low-flow alarm |
| Line blocked | Maintenance will be needed | Low-flow alarm | |
| Flushing | |||
| Control valve closed by operator | Loss of production | Low-flow alarm | |
| Tank empty | Loss of production | Operating procedures | |
| Low-flow alarm | |||
| Less Flow | Line clogged | Loss of production | Low-flow alarm |
| Flushing | |||
| More Flow | Control valve open too far | Loss of quality in tank | Operating procedures |
| Reverse Flow | Pump stops, control valve open, pressure in B > A | Gas is forced into Tank A and escapes to atmosphere | Control valve closed by operator before pump stops |
| Control valve leakage when pump is stopped | Gas is forced into Tank A and escapes to atmosphere | ||
| Less Temperature | Loss of stream supply | High viscosity, pump cannot deliver, risk of clogging pipes | Operating procedures |
| Low-temperature alarm | |||
| Instrument fails | High viscosity, pump cannot deliver, risk of clogging pipes | Operating procedures | |
| More Temperature | Temperature control fault on steam jacket | Excessive vapor from the acid, environmental pollution | High-temperature alarm |
| Acute toxic risk to persons | Extended vent stack | ||
| High rate of corrosion | Rubber-lined tanks and vent stack | ||
| Less Level | No supply | No transfer | Operating procedures |
| Outflow exceeds inflow | Pump damage | Operating procedures | |
| More Level | Uncontrolled input (inflow exceeds outflow) | Overflow to effluent drains | Operating procedures |
| Acid spills | High-level alarm | ||
| Less Composition | Uncontrolled input | Reduce yield to Tank B | Operating procedures |
| More Composition | Upstream mixture error | Pump drive overload. pump over-heats, moderate risk of fire in pump | Electrical overload switch fitted |
| Low temperature (see above) | |||
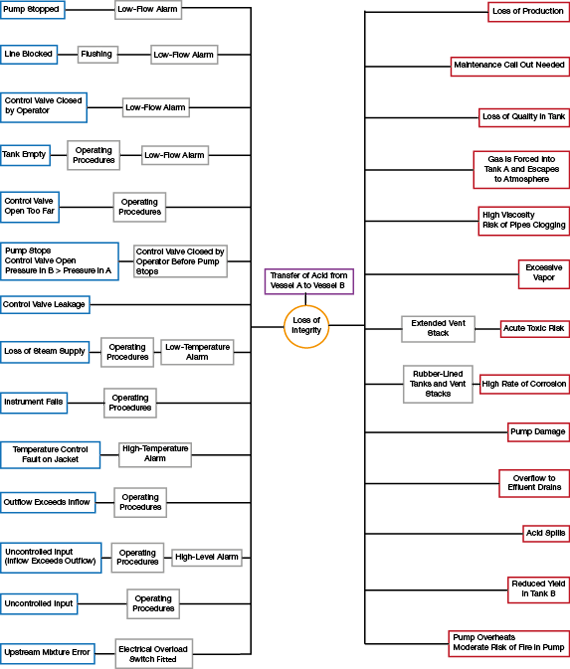
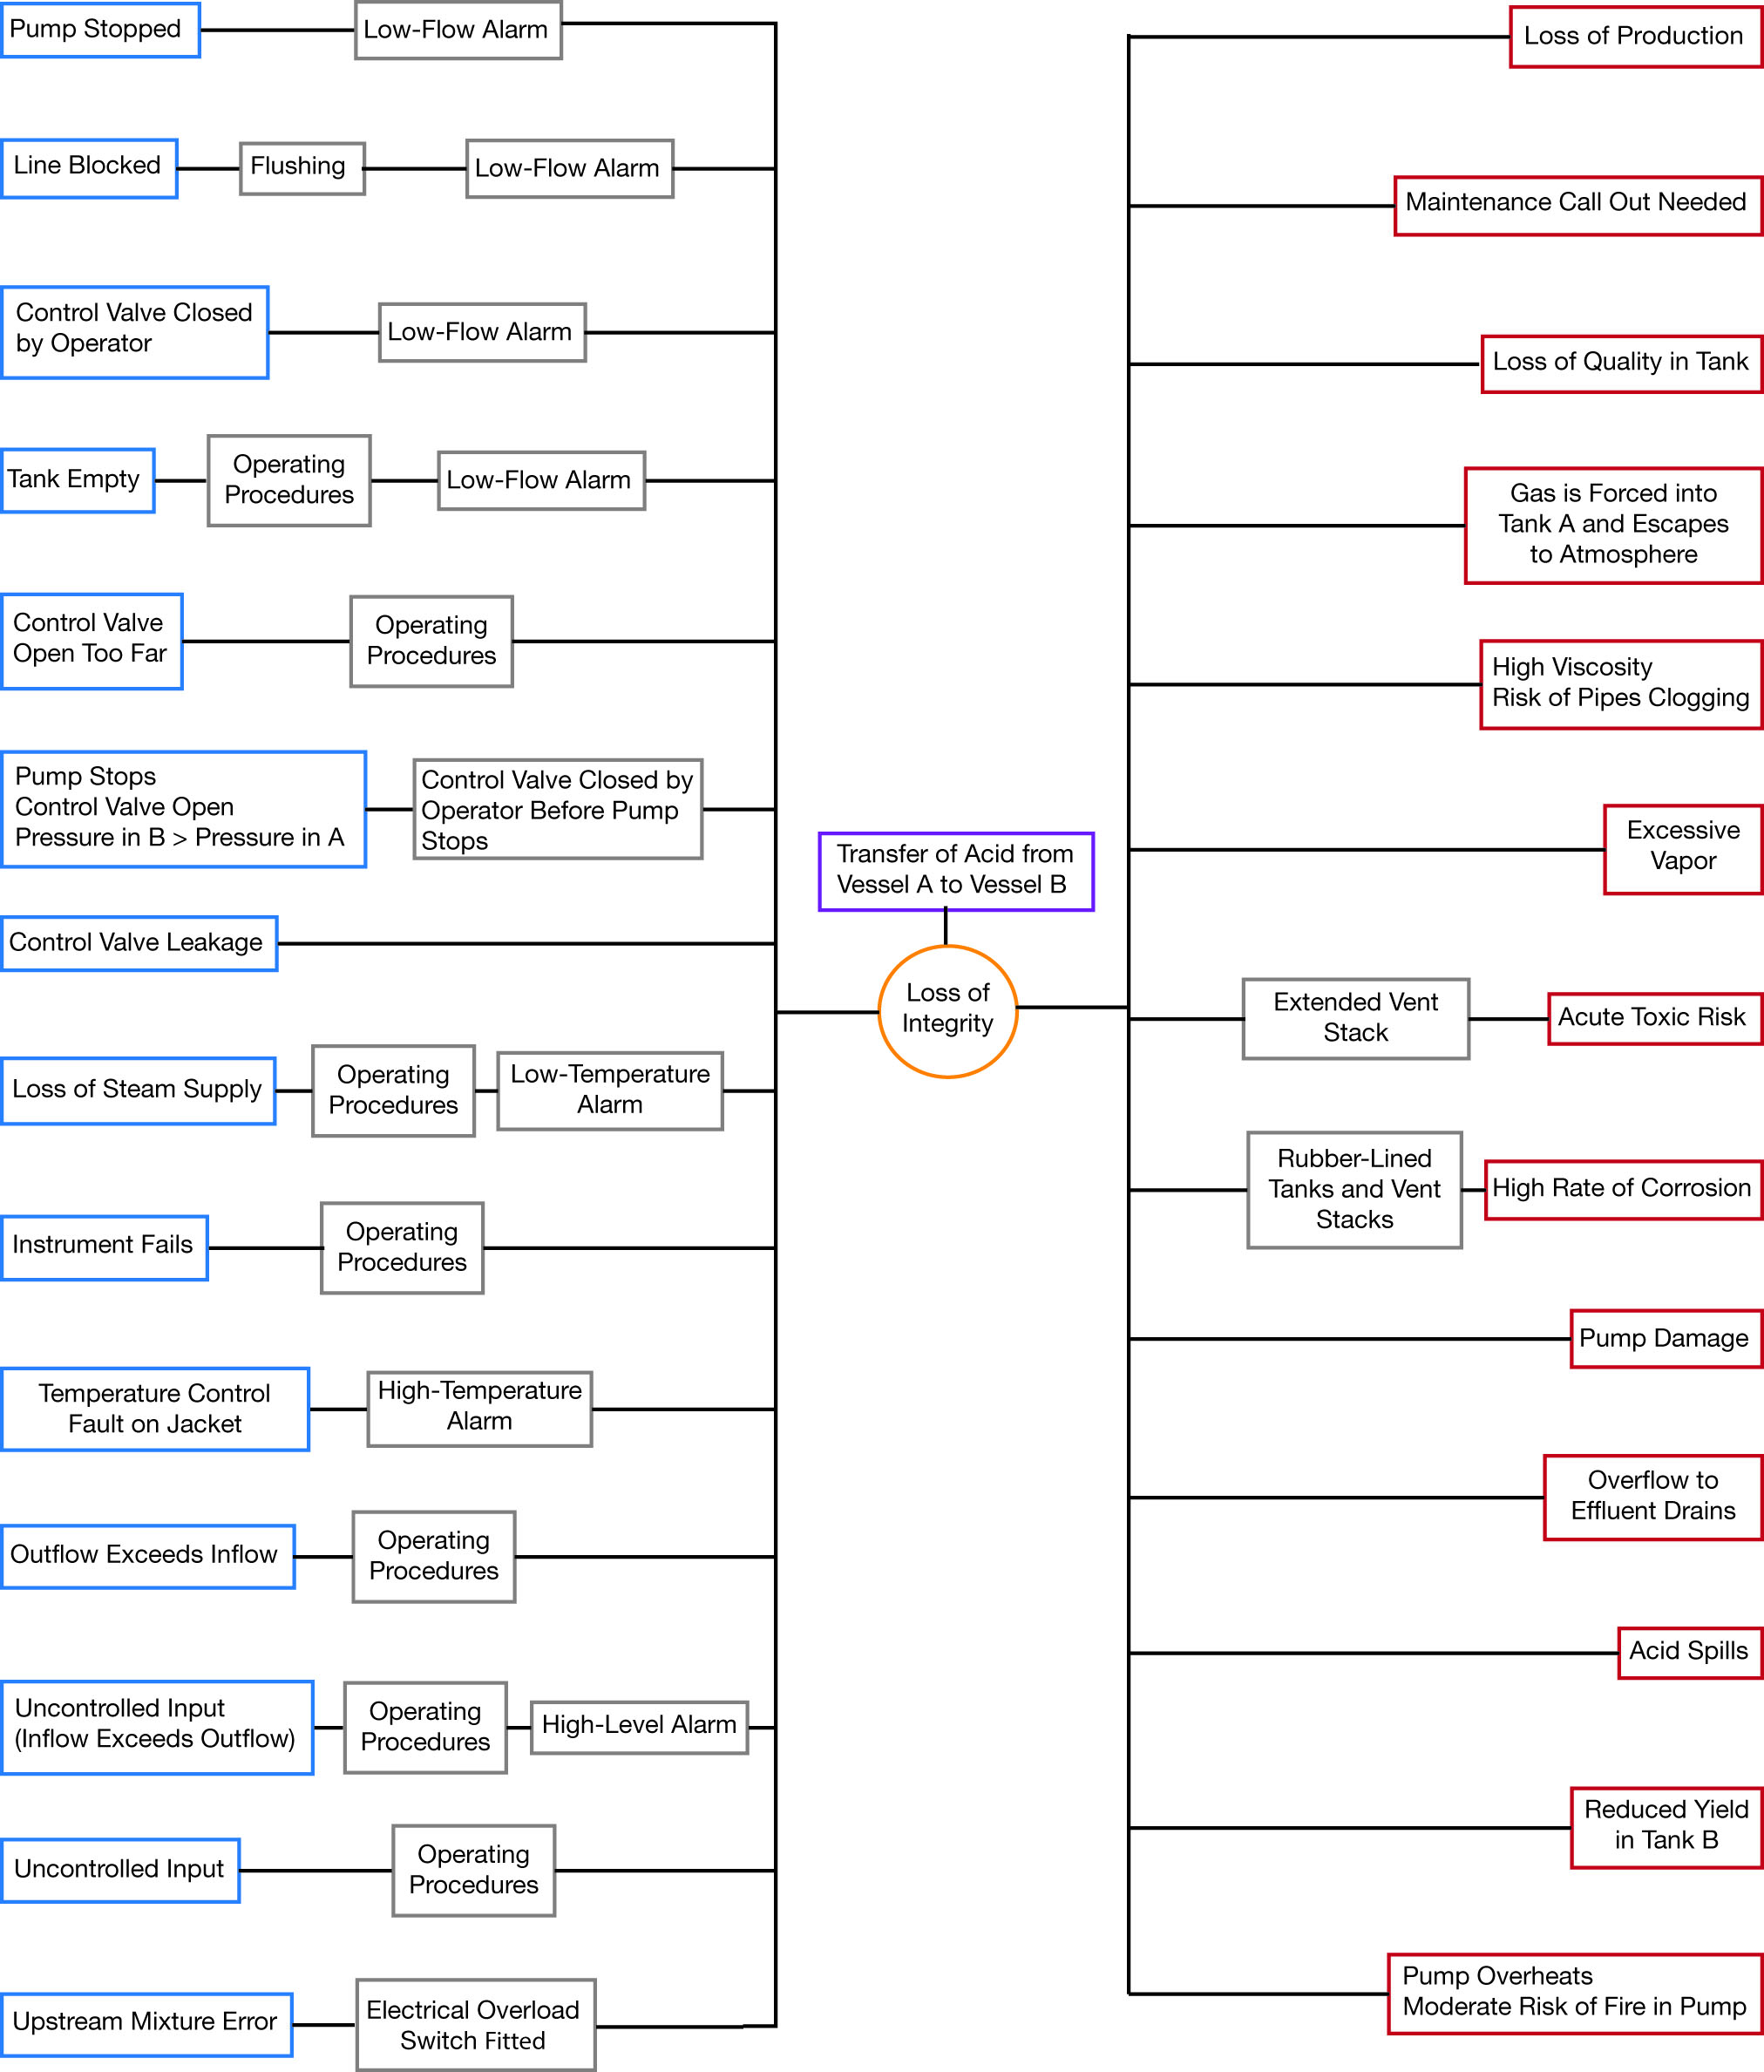
▲Figure 4. A bowtie diagram developed from a HAZOP worksheet shows that loss of integrity can have many consequences. This visualization reveals that many threats have prevention measures, but very few consequences can be mitigated.
Representing the acid transfer between the vessels in a bowtie format shows a potential imbalance between prevention and mitigation safeguards (Figure 4), as there are more barriers to the left (threat) side of the top event than the right (consequence) side.
Converting the HAZOP worksheet to a bowtie diagram after the study reveals the lack of mitigation measures. However, it is more efficient to spot such discrepancies earlier in the study. Recording the discussion on a bowtie in real time allows this deficiency to be addressed sooner.
Challenges to adopting bowties
The conversion of rows of text in a HAZOP worksheet, which is a one-dimensional depiction of a single cause with a single consequence, into a two-dimensional diagram with multiple causes connecting to multiple consequences, does reveal the big picture and makes all threats and all consequences visible. However, not every threat causes every consequence. Some form of threat-to-consequence mapping is required, but not all bowtie software tools have this capability. It is therefore better to use software specifically designed for bowties, as the more familiar Microsoft Office suite of programs does not readily provide such functionality.
Final remarks
The enhanced HAZOP methodology approach using bowties exploits the effectiveness of graphical scenario development and provides long-term process safety knowledge retention; it is easier to remember images than it is to memorize words. Process safety information can be easily migrated from textual HAZOP worksheets into the visual bowtie representation.
An initial step would convert existing PHA or HAZOP worksheets into bowtie diagrams to test the effectiveness of the technique. With positive results, engineers would begin to document future PHAs using bowties. With the enhanced methodology in place, conventional textual information from worksheets is enhanced to become visual knowledge.
Literature Cited
- Lawley, H. G., “Operability Study and Hazard Analysis,” Chemical Engineering Progress,70 (4), pp. 45–56 (April 1974).
- International Electrotechnical Commission, “Hazard and Operability Studies (HAZOP Studies) — Application Guide,” IEC 61882:2016, Geneva, Switzerland (2016).
- Center for Chemical Process Safety, “Guidelines for Hazard Evaluation Procedures,” 3rd Edition, CCPS, American Institute of Chemical Engineers, New York, NY (2008).
- Institution of Chemical Engineers, “HAZOP: Guide to Best Practice,” 3rd ed., Rugby, U.K. (2016).
- Institution of Chemical Engineers, “HAZOP and HAZAN,” 4th ed., Rugby, U.K. (2001).
- Jones, D. W., “Lessons from HAZOP Experiences,” Hydrocarbon Processing (Apr. 1992).
- U.K. Health and Safety Executive, “HSE Offshore Technology Report OTO 96 002 Quality Assurance of HAZOP,” Sheffield, U.K. (1996).
- U.K. Health and Safety Laboratory, “Review of Hazard Identification Techniques,” HSL/2005/58, Buxton, U.K. (2005).
- Center for Chemical Process Safety, “Bowties in Risk Management: A Concept Book for Process Safety,” American Institute of Chemical Engineers, New York, NY, and John Wiley and Sons, Hoboken, NJ (2018).
- Vaughen, B. K., and Bloch, K., “Use the Bowtie Diagram to Help Reduce Process Safety Risks,” Chemical Engineering Progress, 112 (12), pp. 30–36 (Dec. 2016).
1

Copyright Permissions
Would you like to reuse content from CEP Magazine? It’s easy to request permission to reuse content. Simply click here to connect instantly to licensing services, where you can choose from a list of options regarding how you would like to reuse the desired content and complete the transaction.