
This article is based on a presentation given at the 2018 Spring Meeting and 14th Global Congress on Process Safety (Apr. 22–25, 2018, Orlando, FL).
In the chemical process industries, natural disasters are commonly thought of as “Acts of God.” However, the risks of such events can be diminished with the right planning and preparation.
Natural hazards, such as hurricanes, tornadoes, and floods, can disrupt industrial facility operations and cause significant economic losses. This is particularly true in the chemical process industries (CPI), where facilities are often located in coastal areas that are prone to hurricanes or near rivers susceptible to flooding.
FM Global is a leading property insurance company whose clients include more than one-third of all Fortune 500 companies. After a major natural disaster, FM Global sends engineers to its clients’ facilities to investigate. During loss investigations, there is a common perception that natural disasters are “Acts of God,” and adequate insurance coverage is considered the primary (and only) protection strategy. However, through hazard analysis and catastrophe-response planning, facilities can limit or mitigate the risks posed by natural hazards.
This article describes how CPI facilities can reduce risk of natural disasters by adopting wind and flood mitigation measures and creating detailed catastrophe-response plans. Case studies from two facilities that were impacted by hurricanes in 2017 demonstrate the importance of catastrophe preparedness and response planning.
Natural hazards and their impact on industry
Natural hazards occur due to geophysical, meteorological, hydrological, or climatological upsets (Table 1). The location of a facility establishes which of the perils in Table 1 are credibly present and the frequency and severity at which they may occur. These events can negatively impact plant buildings, equipment, and continuity of operations. If the risks are not properly managed, natural hazards can have significant financial impacts on the company owning the assets.
| Table 1. Natural hazards can be grouped into four main categories: geophysical, meteorological, hydrological, and climatological. | |||
| Geophysical | Meteorological | Hydrological | Climatological |
| Earthquake | Hurricane or Cyclone | Flood | Freeze |
| Tsunami | Extreme Rain | Surface Water | Wildfire |
| Volcanic Activity | Wind/Tornado | Avalanche | Drought |
| Landslide | Hail/Ice Storms | ||
Historically, natural hazards account for more than 15% of all commercial and industrial property insurance losses in any given year throughout the world. In some years with extreme activity, natural hazard losses have approached 50% of the total. In 2017, over a span of 26 days, FM Global experienced 2,600 natural hazard losses.
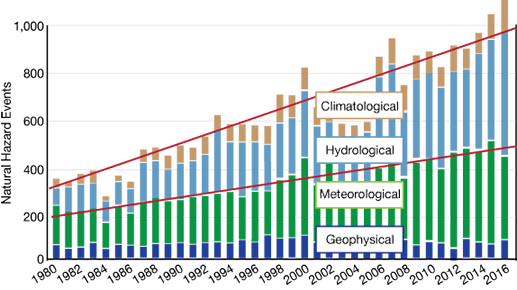
▲Figure 1. The number of reported natural hazard events that impacted industrial facilities has increased since 1980. Source: Adapted from 2016 Munich Re, Geo Risks Research, NatCatSERVICE.
The number and severity of natural hazard events that have impacted major industrial facilities has steadily increased for the past 30 years (Figure 1). This increase can be attributed to several factors, such as globalization, urbanization, and climate change.
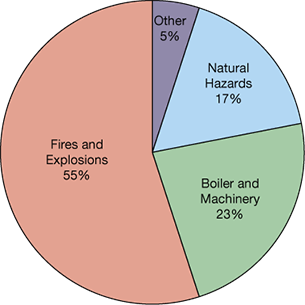
▲Figure 2. Natural hazards accounted for a large portion of the losses experienced by FM Global’s chemical industry clients from 2008 to 2017.
Furthermore, CPI facilities are experiencing more losses associated with these events. Over the course of a 10-yr period, natural hazards represented 17% of all the losses to FM Global’s chemical clients (Figure 2).
CPI facilities are particularly at risk for exposure to natural hazards because of their proximity to river or coastal areas. A common expectation is that through specific site selection and design, natural hazard risks will be completely mitigated. However, this is rarely the case. The enormous energy within hurricanes, floods, earthquakes, freezes, and other natural disasters is difficult to comprehend or predict.
Natural hazard events, perceived as rare and infrequent, are not a normal process operating condition and as such are not addressed in many process safety programs. The general assumption is that these hazards were addressed during the design and construction phase. Compliance with initial design specifications is expected to limit or prevent any chemical release or property damage caused by a natural disaster. However, catastrophe-response planning is just as critical to mitigating natural hazard risk.
The next sections explore how to estimate the probability that your facility will be exposed to a specific natural hazard, and how to use that probability as a basis for facility design and preparedness planning.
Understanding hazard probability
The first step in managing natural hazard risk is understanding the potential for exposure. Are you in a flood zone? Is your site prone to severe wind events? A location in an elevated area may not have a credible flood exposure, just as location distant from coastal areas may not be credibly exposed to a hurricane. To understand the risk, you need to understand the probability of an occurrence and relative magnitude of the event. From that, a basis of design can be established to mitigate the hazard and response plans can be developed for prompt recovery.
Determining whether a location could be exposed to a specific natural hazard is usually assessed geographically and displayed by mapping tools. Such tools are often developed by government bodies, code and standard writing entities, and insurance companies.
This article focuses mostly on the natural hazard risks of flooding, wind, and hurricanes. The sidebar provides a list of available resources that will help you identify the inherent wind or flood threat at a specific location.
Flood and Wind Maps
FM Global offers a global flood map tool at www.fmglobal.com/research-and-resources/global-flood-map. This mapping tool allows a quick determination of a potential flood exposure, even in areas of the world where no government flood maps are available. It provides a worldwide view of moderate (i.e., 500-yr) and high-hazard (i.e., 100-yr) flood zones across the globe. Unlike maps based solely on historical flood data, the Global Flood Map is built using hydrology and hydraulic science, and it considers information like rainfall, evaporation, snowmelt, and terrain. These maps should be used in addition to any official flood maps available, which may have a higher degree of granularity and accuracy for a specific site/location.
Other flood maps can be found at:
- U.S.: FEMA Flood Map Service Center, https://msc.fema.gov
- England and Wales: “Long term flood risk assessment for locations in England,” https://flood-warning-information.service.gov.uk/long-term-flood-risk
- Scotland: Scottish Environmental Protection Agency, http://map.sepa.org.uk/floodmap/map.htm
Likewise, a wind map can help determine what windspeed certain buildings should be designed to withstand. Wind maps can be found at:
- Applied Technology Council (ATC), https://hazards.atcouncil.org
- American Society of Civil Engineers (ASCE) ASCE 7 Online Hazard Tool, https://asce7hazardtool.online
- ASCE/SEI 7-16 standard “Minimum Design Loads and Associated Criteria for Buildings and Other Structures,” which provides wind maps based on ultimate wind speeds on a 300-yr, 700-yr, or 1,700-yr MRI
- FM Global Property Loss Prevention Data Sheets, No. 1-28, “Wind Design,” www.fmglobal.com/research-and-resources/fm-global-data-sheets.
Natural hazards are commonly related to a mean recurrence interval (MRI), which is an estimate of the likelihood of an event of a specific magnitude to occur. This is a statistical measurement based on historic data denoting the average recurrence interval over an extended period of time. The MRI, or return period, is commonly misinterpreted as a regular interval in which the event of a specified severity will occur.
The MRI of an event (e.g., flood, winds, damaging ground motion, rainfall, etc.) is the average number of years between successive events. A mean return of 500 years does not imply that successive events will be exactly 500 years apart. Nor does it imply that there is 100% probability of its occurrence in a 500-yr period. For example, think about rolling a six-sided die. There is a one-in-six chance of rolling a 3 (i.e., a return period of 6). However, in six rolls of the die, it is possible that a 3 will not be rolled, and it is also possible that a 3 will be rolled more than once.

The probability of an event occurring at least once in a given period is:
where P is the probability that an event of mean return period T will occur at least once in a time period t.
For example, the probability of a 500-yr flood occurring at least once in 50 years is:
P = 1 − e(−50/500) = 0.0952 = 9.5%
Likewise, there is about a 37% chance that a 500-yr event will not occur in a given 500-yr period. Assuming independence of events, the probability of a 500-yr event occurring at least twice in 500 years is 26%. Table 2 demonstrates how the probability of an event occurring changes with return period and facility life.
| Table 2. The probability that an event will occur at least once during the facility’s lifetime increases as facility life increases and return period decreases. | ||||
| Return Period | Facility Life, yr | |||
| 10 | 25 | 50 | 100 | |
| Natural Hazard Event Probability | ||||
| 10 years | 65% | 93% | 99% | 100% |
| 25 years | 34% | 64% | 87% | 98% |
| 50 years | 18% | 40% | 64% | 87% |
| 100 years | 10% | 22% | 40% | 63% |
| 500 years | 2% | 5% | 10% | 18% |
Most natural hazard maps identify hazards with an MRI of 10 to 1,000 years. Probability can also be considered in terms of the same risk matrix used in process safety evaluations. Organizations that have an established risk-ranking methodology using a risk matrix are encouraged to use those tools to rank natural hazard risks.
When ranking risks, it is important to understand that an MRI is not a probability of occurrence, but a probability that the event will not be exceeded. A location in a 100-yr flood zone has a probability of occurrence of at least 1% in any given year. When expressed on a flood map, the 1% probability is basically at the boundary line as drawn on the map. If the location is relatively close to a river and at a lower elevation, the actual probability of occurrence may be much higher than the stated 1%.
Likewise, a location outside of a 100-yr flood zone but within a 500-yr flood zone has a probability of an event happening between 1% and 0.2% in a given year. As a result, for order-of-magnitude risk ranking, 100-yr natural hazard exposures are typically characterized as 10–1 and 500-yr exposures are categorized as 10–2 on a risk matrix. This may vary depending on the risk ranking definition of the risk matrix.
Using flood maps as a design basis
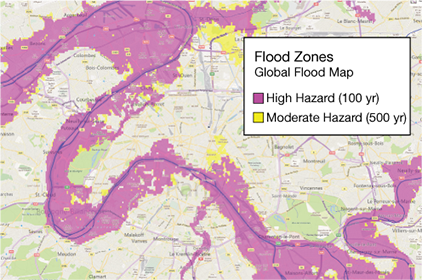
▲Figure 3. In this example flood map of Paris, the areas in purple represent 100-yr flood elevations and areas in yellow represent 500-yr flood elevations. The areas in purple have the highest risk of flooding.
Flood maps can provide specific flood depths for the various recurrence intervals. They allow you to compare the expected flood depth with the elevation of buildings and equipment at your site. This creates a simple basis of design, where buildings or equipment should be elevated above a certain level. A safety factor of one to two feet is typically added for construction purposes. Often, flood maps will show the 100-yr flood elevation in one color and the 500-yr elevation in another color (Figure 3).
Flood maps provide a static representation of a flood footprint of a body of water. However, the terminology used on flood maps varies by country. In Australia, high-hazard flooding (i.e., a 100-yr event) includes both flood depth and velocity.
In general, flood maps do not show the more likely events, such as 10% annual exceedance (i.e., 10-yr) and 2% annual exceedance (i.e., 50-yr). Thus, the maps do not show how early flooding will start at a facility. A facility may start to flood to a significant depth before it ever reaches the 100-yr annual level.
Frequently (as shown by our loss history), flood losses occur at locations that are not shown in a mapped flood zone. Examples not normally covered by a standard flood map include collapse of a road embankment across the floodplain during an event, blockage by debris of a structure meant to divert floodwaters off the watercourse, diversion of floodwaters via a navigation canal, and faulty operation or failure of a levee or a dam.
Connections from adjacent flood zones to below-grade areas (e.g., the city of Houston’s downtown pedestrian tunnel system) are not always covered by flood maps. And, the flood maps may not address smaller bodies of water (e.g., small streams, local drainage ditches, small culverts passing below buildings, or contributory drainage areas less than one square mile).
Flood defense systems may be shown on flood maps, but the current condition of the flood defense may not be well represented by the maps, which may have been developed years earlier. The defense system may have reached the end of its designed lifespan or have been poorly maintained, or the flood map might not show the increased extent of flooding caused by upstream development or changes in the environment since the map was developed.
Be aware that flood maps created by different organizations may take a different approach to mapping flood defense systems. One map may not consider flood defenses and show an area as flooding, while another map may show the same area as not being flood exposed at all.
Using wind maps
On wind maps, the recurrence interval is typically defined for the entire map. The strength of wind to use in the building design should be selected based on the number of occupants within the building or how important the building is to the owner.
Because wind maps display ultimate wind speeds, it is generally recommended that designers implement a safety factor of 1.6. The safety factor is typically applied as a multiplier to the anticipated force. It accounts for potential inaccuracies in the design windspeed, variability in the strength of construction materials, poor workmanship, and weakening due to aging, wear and tear, etc. Our loss history demonstrates that variability in the strength of construction materials and workmanship issues are prevalent in the CPI. Although a safety factor of 1.6 is reasonable for the building framework, it is not reasonable for securement of walls, roof cladding, secondary framing, and other components. A safety factor of 2.0 should be used for these components.
When using flood maps and wind maps to design a facility to withstand these natural hazards, the information should be documented and placed within the process safety management package, and should be included as input to process hazard analyses. The serviceability of process structures and equipment during flood and wind events, as well as their design limitations, should be understood.
Managing flood risks
Insurance can be a critical component in managing natural hazard risk, but it should not be the only method. Once you have conducted a hazard analysis, you can take some simple and practical steps to manage flood risks at your facility.
Managing flood risk starts with elevation. Consider elevating the site, process, buildings, utilities, equipment, and/or inventory. The ultimate strategy is to ensure that as much of the facility can continue to operate without interruption due to flooding. It is important to elevate all equipment to a specific height relative to the flood point. It is also important to understand any local conditions that could raise the height of flooding.
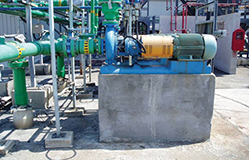
▲Figure 4. A key monomer pump is elevated above the 500-yr flood elevation.
There are several more strategies that can help reduce flood damage and downtime. In order of decreasing reliability, these are:
- Designing the facility to be constructed outside of any flood hazard (new construction), or permanently relocating the existing facility or operations.
- Raising the site above a practical flood elevation, considering the 500-yr level as the benchmark. This can include relocation of equipment and production lines to areas higher than the flood.
- Building permanent flood defenses around the site, considering the 500-yr flood level.
- Protecting a portion of the site’s critical assets by raising them above the flood line (Figure 4) or protecting to 500-yr standards (e.g., building low-level earthen embankments, flood walls, or landscaping to redirect storm water from important areas).
- Deploying emergency devices such as flood doors, flood gates, or check valves on drainage systems, and organizing emergency response plans until permanent solutions are made.
Often, the most effective flood mitigation approach is a combination of strategies. Proper design of the processes and buildings that could be flooded is required to minimize damage. Shallow floodwaters that fill basements seldom damage the building structure. Structural damage becomes a possibility when deep waters rise to the first-story walls or high-velocity flows are experienced.
One of the most important steps to minimize flood damage after the flood has receded is to quickly clean up the damage the flood has caused. To accomplish a fast cleanup, power, heating, and air conditioning must be restored quickly. When designing the location or selecting equipment for power systems and heating, ventilation, and air conditioning (HVAC) systems, consider that coastal floodwater can leave salt deposits and create paths for arcing. Electrical equipment, particularly dry-type transformers, high-voltage air circuit breakers, and modern control equipment with semiconductor circuitry, are highly susceptible to water damage.
Boilers, furnaces, and ovens will sustain extensive damage if floodwaters rise while the unit is firing or still hot. Fine silt will penetrate combustion, air, and gaseous fuel piping, as well as burner assemblies.
Tanks can also sustain major damage during flooding. Tanks will become buoyant as floodwaters rise, which can damage the tank, associated structures, and equipment. As tanks or equipment move, a loss of containment of the tank contents is possible. If secondary containments, such as dikes or bunding, are overwhelmed, the tank contents may contaminate a large surrounding area.
Equipment located outdoors, although weather-resistant, is susceptible to the same damage as equipment located indoors. Weather protection is usually not tight enough to keep out floodwater. Water velocities of greater than 7 ft/sec will knock over most outside equipment that has not been specifically designed to resist the force of the moving floodwater.
Wind mitigation
During a windstorm, damage to the structural frame of a building or main process structure seldom occurs. The total wind load acts on components and cladding, creating load paths through the various components and back to the supporting structural members (i.e., beams, joists, purlins, girts, studs, etc.). The ability of the vessel or building to resist this wind load is based on the weakest link in this load path, which is usually the supporting components and cladding.
Windstorms are typically concurrent with or followed by significant rainstorms. Cladding failures allow rainfall to accumulate within breached areas, wetting contents and causing extensive damage. Even if it is not raining during the failure, the possibility of contents getting wet remains until the cladding is repaired and/or replaced. For this reason, keeping the building or equipment envelope sealed is one of the most effective ways of mitigating windstorm risk. The goal is to prevent any breach of the envelope that could let rain, wind-driven rain, or debris enter.
The envelope can be breached in various ways. For example, lightweight cladding or inadequately secured steel, aluminum, or plastic panels may tear away from structural supports. Hatches, windows, doors, and lightweight wall cladding may become broken by windborne debris, such as gravel on control room roofs, weak supporting structures (e.g., trailers), scaffolding, or weak piping insulation. Often, pressures exerted on the building can blow open hatches, windows, or doors, causing a breach of the envelope.
High winds can also cause roofing and roof deck materials to tear and/or peel off structures, including concrete roofs over control rooms. Envelope breach can also be caused when inadequately secured roof-mounted equipment is blown out of place, damaging the roof cover and allowing wind-driven rain into a control room.
Some cost-effective methods of limiting breaches in these areas include:
- replace lightweight cladding with heavyweight materials
- increase banding on process piping and equipment insulation
- brace hatches, dock doors, and windows from internal and external pressure forces
- protect doors and windows with impact-resistant materials, such as shutters, impact-resistant glass, heavyweight steel cladding, etc.
- select an adequate roof assembly that includes more fasteners in the corners and perimeter (where the wind uplift is the greatest), and eliminate aggregate gravel roofs
- secure all roof-mounted equipment to prevent dislodgment.
The process hazard analysis team can assist in determining other vulnerabilities of the facility. The steps taken to mitigate these vulnerabilities should be included in the site’s management of change (MOC) process. And from there, any further changes to this design should undergo an MOC evaluation. Modifications to building and/or process components, such as equipment bracing, building cladding, new roof covers, power distribution, piping insulation, equipment elevations, or material storage should undergo MOC. Even minor changes — such as modifying the roof flashing over a control room — can reverse mitigation measures and leave the structure vulnerable to wind damage.
Catastrophe preparedness and response
A well-developed catastrophe-response plan considers all hazards, risk factors, and mitigation measures for a specific natural hazard event, and outlines steps for event preparation, recovery, and site stabilization. The plan also describes potential impacts to the neighboring community.
An effective catastrophe-response plan assumes that most of the community is heavily impacted. Employees may be forced out of their homes and may need to reside in distant, unfamiliar, and/or uncomfortable areas while reporting to work. The facilities and operational bases of most municipality emergency organizations are themselves heavily impacted. Hospitals and other community establishments may be inoperable. Even most high-rise buildings in the city, although still standing, may not be useable because of lack of electricity. Infrastructure may be so badly disrupted that there are stoppages or extensive shortages of electricity, water, sewage services, and means of communication and transportation.
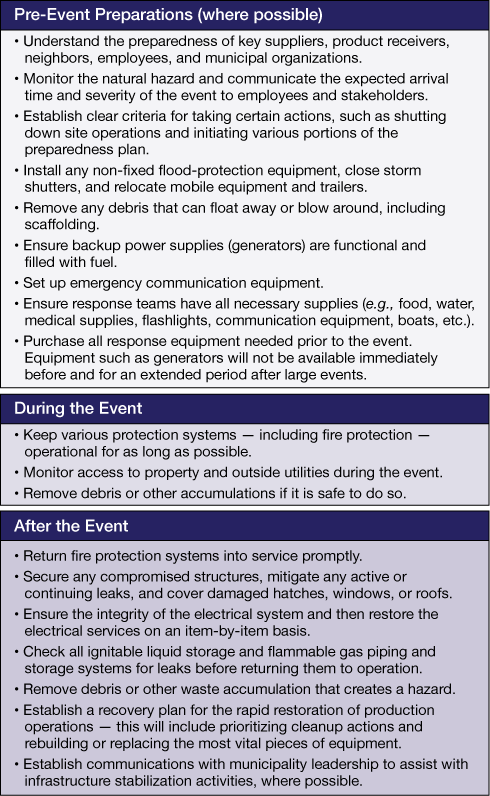
▲Figure 5. A catastrophe-response plan should include a list of steps to take before, during, and after a natural disaster.
A catastrophe-response plan should include a list of steps to take before, during, and after a natural disaster (Figure 5).
The amount of warning time is important in developing a meaningful response plan. Most preparedness plans for wind and flood events can be initiated far in advance, with ample time to start taking critical actions. Some events, such as flash floods and tornadoes, occur so quickly that there is no time to do any meaningful preparation immediately prior to the event. In such cases, the response plan should focus on the recovery phase.
Flood considerations in catastrophe preparedness
It is important to consider the weather event that will trigger the flood, where the floodwaters will come from, likely warning time, depth of water expected, length of time water will remain in the facility, the critical areas likely to be flooded, and the business impact. The U.S. Geological Survey (USGS) provides real-time river and stream level data, which serves as a readily available method to track an impending flood.
The flood catastrophe-response plan should also describe a procedure to shut down/de-energize utilities in an orderly manner to reduce ignition sources and the amount of damage. Other pre-event preparations for flooding events include:
- raise and relocate highly valuable and easily moved equipment, such as pumps or metering equipment
- close flood gates, erect stop logs or water barrier tubes, etc.
- shut down ignitable liquid and flammable gas systems
- cover large stationary machines with water-displacing, rust-preventive compound
- fill empty storage tanks to a safe hydraulic level to prevent them from floating
- close isolation valves on stormwater drainage systems
- inspect sump pumps to ensure they are in operation or ready for operation.
Wind considerations in catastrophe preparedness
Hurricanes can wreak havoc over very large geographic areas and impact millions of people. All response plans should consider the impact on the larger community. Pre-event preparations for a hurricane should include:
- shut down operations that depend on outside power sources, as grid instability and power surges can severely damage process equipment
- anchor or move outside storage, stock, and moveable equipment, including trailers, to more-secure areas
- fuel all mobile equipment that might be needed after the storm.
- stock extra fuel if possible, as fuel supplies may be limited after the storm due to availability of electrical power to operate fuel pumps
- cover all vital equipment or records with water-resistant material (e.g., plastic sheeting)
- clean all roof drains and catch basins
- protect openings (windows, dock doors, hatches, etc.).
Case study: Pharmaceutical plant hit by Hurricane Maria
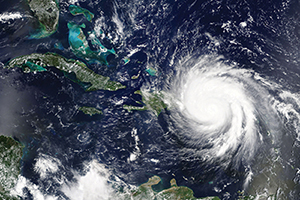
▲Figure 6. Hurricane Maria made landfall in Puerto Rico in Sept. 2017.
In September 2017, Hurricane Maria (Figure 6) impacted a pharmaceutical plant in Puerto Rico. The site was subject to wind gusts of 150 mph. Prior to 2017, the facility had undergone major reconstruction to harden buildings, outdoor process vessels, and infrastructure. The buildings were redesigned to withstand 175 mph wind speeds and the 200,000 ft2 roof system over the clean room environment was strengthened.
In addition, the windows were shuttered, dock doors were braced, and emergency power generators were installed and stocked with enough fuel for three days. Outdoor process vessels were provided with additional bracing, and strapping of piping insulation was increased.
Several days before the storm and in anticipation of the hurricane, the site made final preparations to secure the facility, which included filling up outdoor storage tanks, filling all fuel levels for emergency generation, and placing operations into safe standby mode. This included filling one process vessel near the clean room with hydrogen peroxide from outdoor storage vessels.
As the hurricane made landfall approximately eight miles south of the facility, the hurricane quickly impaired power and water supplies. Emergency response teams isolated emergency generators as flying debris impacted outdoor power lines and ceramic insulators.
Above the cleanroom building, approximately 12 exhaust ventilation stacks and HVAC hoods became dislodged. These stacks and hoods were secured using 3/8-in. cables tied into wood curbs. This equipment subsequently traveled over the roof cover, puncturing approximately 70 holes in the roof. Water from the roof entered the building through these holes, wetting over 58,240 ft2, including several clean rooms. The water was several inches deep on the floor.
One stack that was dislodged over the cleanroom was the relief line for the process vessel with hydrogen peroxide. The damaged line allowed corroded metals from the roof into the vessel. In addition, the loss of power inhibited water delivery for cooling lines to this vessel. The loss of cooling and contamination from metals accelerated the decomposition of the peroxide, which subsequently deformed the vessel. Fortunately, the broken stack allowed gases and vapors to escape, preventing the vessel from bursting.
The facility resumed partial production operations three months after the event. Prior to the hurricane, personnel did not consider the impact the roof-mounted equipment would have if it became dislodged. Upon investigation, the cables that held the roof equipment in place were insufficient for the design wind speeds. This equipment was not afforded the same oversight as other key process equipment and building components. The engineers should have considered what would happen if the equipment became dislodged and dragged over the rooftop. The rooftop equipment should have been identified as process-critical and new restraints should have been implemented to withstand the design wind speeds.
A more-thorough hazard review would have identified the hazards of decomposition of the hydrogen peroxide. The engineers should have developed more robust measures for its cooling and storage during the hurricane. And, these measures should have been documented in the site’s hurricane response plan.
Case study: Hurricane Harvey impacts organic peroxides facility
In August 2017, Hurricane Harvey caused extensive flooding to an organic peroxides production facility in Crosby, TX.
As the event progressed, the site implemented a response plan that had been successful in mitigating previous incidents. Much of the activity was oriented around ensuring that there was sufficient refrigeration of the finished organic peroxides, to prevent explosive decomposition and an overall loss of containment.
Initial activity focused on switching to a fixed backup generator, to ensure proper refrigeration of the materials. As the event progressed, the backup generator was flooded. Site activity then switched to relocating the materials to portable refrigerated trailers. Power to the trailers was subsequently compromised and the flooding was too deep for trucks to move the trailers. Ultimately, the site was evacuated and the material eventually exceeded the self-accelerating decomposition temperature (SADT), which caused an explosion and fire that involved several trailers.
This event has been widely reported and there is significant commentary on the site’s ineffective emergency response. While there may have been opportunities for improving the emergency response, a better understanding of the potential flood exposure could have greatly improved mitigation measures.
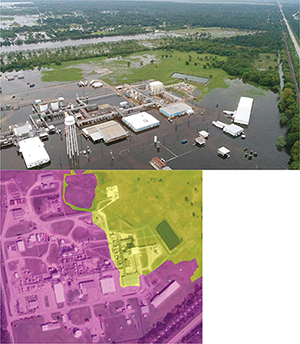
▲Figure 7. The level of flooding is consistent with flooding between a 100-yr and 500-yr event, as depicted in the FEMA flood zone map at left (where purple is 100-yr and yellow is 500-yr flood zone).
Figure 7 compares actual site flooding with the 500-yr flood zone, established by the Federal Emergency Management Agency (FEMA). As shown in these images, the level of flooding is consistent with flooding between a 100- and 500-yr event. In fact, comparison of the nearest river gauge station with published flood profiles shows that the event was very close to a 500-yr event. As such, the event was predictable, with a reasonably well-defined probability of occurrence that would likely have been placed in the likely or even very likely category on most corporations’ risk matrices.
The site should have implemented more mitigation strategies well before the hurricane began. For example, all buildings handling unstable materials and all components of the emergency utility service should have been sufficiently elevated above the 500-yr flood level. A safety margin above the established flood level — such as 2 ft above the 500-yr level — should have been implemented to account for additional uncertainties.
With the appropriate understanding of the hazard and better fixed mitigation efforts, this site could have prevented the materials reaching an unstable state and the associated fire and explosions.
Note: This event is under investigation by the U.S. Chemical Safety Board (CSB). Additional information is available at www.csb.gov, including videos depicting the progression of events.
Final thoughts
Natural hazards accounted for 17% of losses to FM Global’s chemical clients in the past 10 years. The perception that such events are “Acts of God” and beyond foreseeable is incorrect. With the proper understanding of the hazard, and better mitigation and emergency response strategies, these risks can be proactively managed.
1

Copyright Permissions
Would you like to reuse content from CEP Magazine? It’s easy to request permission to reuse content. Simply click here to connect instantly to licensing services, where you can choose from a list of options regarding how you would like to reuse the desired content and complete the transaction.