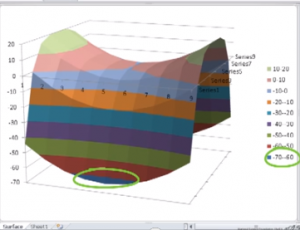
Love it or hate it, Excel is a tool most chemical engineers need to master. Whether you're looking for a tutorial to help you on a project at work, or are a student looking to use the summer months to improve valuable Excel skills, check out this video on 3D plots.
Not looking for 3D plotting? This is just one part of an eight-part series on graphing in Excel (see all parts listed at beginning of video). While you're at it, check out other chemical engineering tutorials in the Learn ChemE Engineering Screencast series.


Comments
Gnuplot and R are a million times better than m$ excel. See <a href="http://commons.wikimedia.org/wiki/Category:Gnuplot_diagrams" rel="nofollow">http://commons.wikimedia.org/wiki/Category:Gnuplo...</a> and <a href="http://ayapin-film.sakura.ne.jp/Gnuplot/pm3d.html;" rel="nofollow">http://ayapin-film.sakura.ne.jp/Gnuplot/pm3d.html...</a> they make the excel graph above look total ...