
This article guides you through a condition monitoring program framework and details techniques to assess the function of your equipment.
Process and maintenance engineers strive to achieve 100% uptime of the plant, avoiding any major malfunctions to keep equipment running properly 24/7 and nearly 365 days a year. Effective equipment maintenance helps to achieve this goal. However, the cost and uptime trade-offs of preventive and reactive maintenance (i.e., repair) must be balanced. This can be achieved via condition monitoring.
In a reactive maintenance scheme (also called run to failure), a machine or a process is allowed to run until it fails, and then efforts are made to bring it back to its optimal or near-optimal state to restore service. Although the initial cost is less than other maintenance methods, the repair costs are often high, owing to lost process output and equipment damage, as well as the risk of hazards to personnel and other equipment.
Preventive maintenance, or time-based maintenance, implements a periodic, custom-designed maintenance schedule aimed at maintaining the machine or its components at the optimal condition to reduce the likelihood of failure. Low rates of failure keep repair costs low, but variable factors such as operating condition and component behavior make determining appropriate maintenance intervals challenging.
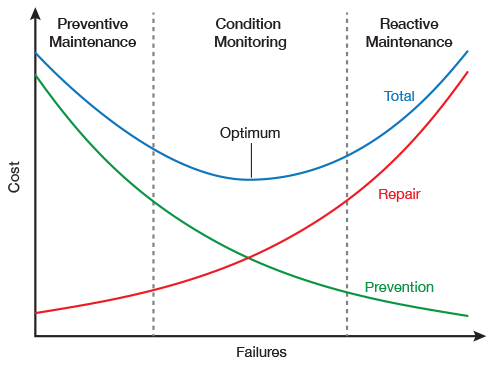
▲Figure 1. Condition monitoring strikes a balance between the cost of performing preventive maintenance and the cost to repair or replace failed equipment under a reactive maintenance program.
Condition monitoring is similar to preventive maintenance. It involves regular scheduled maintenance to uphold machine condition, but with an additional feature — machine condition is evaluated to determine the instant maintenance is needed, without which the equipment cannot be operated without damage or failure. Equipment health is assessed by monitoring dynamic operating characteristics, such as vibration signature and temperature, to create a profile of variations and trends that can be used to predict the need for maintenance. Condition monitoring significantly reduces spare parts and labor costs, and it increase machine availability — effectively reducing net maintenance costs (Figure 1).
A condition-monitoring framework
The framework for a condition-based monitoring (CBM) program includes three major steps:
- select the appropriate condition indicators
- acquire and analyze data using appropriate sensing techniques
- decide whether maintenance is needed and, if so, what type.
1. Select condition indicators. The success of a CBM program relies heavily on selection of the proper condition indicators, which provide the insight necessary to evaluate equipment or process function and failure modes at all operating conditions. Comprehensive knowledge of the functioning and operating condition of the equipment to be monitored, as well as its failure dependencies, is required for successful parameter selection. For example, temperature can be used to calculate heat-transfer coefficients to indicate possible tube fouling, ultrasonic testing can reveal corrosion degradation of pipelines and leakages, vibration analysis can indicate structural problems, and thermographic scans can identify unusual temperature conditions and failing insulation. The parameter(s) selected are the basis for selecting the condition monitoring techniques to be used.
2. Acquire and analyze data. Depending on the parameter selected, specialized sensors collect data that represent the actual physical state of the equipment. Sensors are typically evaluated and selected based on sensitivity, precision, cost, and invasiveness. To the extent possible, sensors should support online measurement of the parameter. Amplification and preprocessing of the output from sensors is also important and is usually integrated in the data acquisition setup.
Once the data are collected, data analysis methods aim to detect incipient faults to provide an indication that a comprehensive analysis is needed. The data analysis techniques, in principle, identify any deviation from normal operating characteristics or causal relationships between events and system failure.
3. Decide on maintenance requirements. Abnormal signals are analyzed to generate recommendations that clearly indicate machine health and maintenance requirements. This decision-making process involves diagnostics and prognostics. Diagnostics focus mainly on the current state of the machine, determining whether the system is at immediate risk of a failure and, if so, the location and the nature of the impending failure. Prognostics aim to predict faults before they occur, estimating the time to failure given the equipment condition and past operation profile. An engineer aided by computer-generated models or models that use artificial intelligence (sometimes a combination of those) make the final maintenance decision.
Condition monitoring techniques. The condition indicators should characterize the function of the entire piece of equipment or a particular component, such as the temperature of a particular part, quality of the oil or lubricant, or vibration pattern of rotating parts. Based on the parameters to be monitored, one or more relevant sensing and analysis technique is chosen.
Temperature measurement
Temperature is a characteristic feature of any electrical or mechanical process. Temperature-based condition monitoring helps to detect potential faults that produce thermal changes. Abnormal thermal variations can reveal problems such as excessive mechanical friction (e.g., due to worn bearings or inadequate lubrication), reduced heat transfer (e.g., heat exchanger fouling), or poor electrical connections (e.g., loose, corroded, or oxidized connections or short circuits).
Two types of sensing technology are used to measure temperature profiles: contact and noncontact. Contact methods of temperature measurement generally include thermocouples, thermistors, bimetallic thermometers, and resistance temperature detectors (RTDs) (Table 1).
| Table 1. Each contact temperature sensor has advantages and disadvantages, which should be evaluated to determine the suitability of the sensor for an intended application. | ||
| Sensor | Advantages | Disadvantages |
| Thermocouple | Rugged | Susceptible to noise |
| Thermistor | High sensitivity | Requires an auxiliary power source |
| Bimetallic Thermometer | Low cost | Error is introduced over time |
| Resistance Temperature Detector (RTD) | Suitable for smaller temperature ranges | Expensive |
Most contact measurement devices require minimal skill on the part of technicians, making them popular in industrial applications. However, noncontact measurement using infrared sensors has become increasingly popular.
Infrared thermography. Thermal cameras can capture infrared radiation emitted by an object to locate an abnormal heat pattern or thermal anomaly. Planck’s Law and Stefan-Boltzmann’s Law are the underlying principles of infrared thermography. All objects with a temperature above 0 K emit electromagnetic radiation in the infrared region of the electromagnetic spectrum, and the intensity of the radiation emitted is a function of the temperature of the object. The radiation is absorbed by a thermal camera, which converts the infrared signature into a colored image or video that can be analyzed to identify temperature variations. Comparing images of the same object taken at different times is an effective way to spot abnormalities.
Infrared thermography is generally classified as either passive or active thermography. In passive thermography, the temperature gradients are naturally present in the materials and structures under test. However, in some cases, the thermal gradient is not prominent, so deeper and smaller defects may not be visible using passive thermography. Active thermography overcomes this challenge by using an external stimulus to induce thermal contrasts. Passive thermography is used mainly for condition monitoring of electrical and mechanical equipment, whereas active thermography is used in gas leak detection, agriculture, biology, and thermal efficiency surveys of buildings.
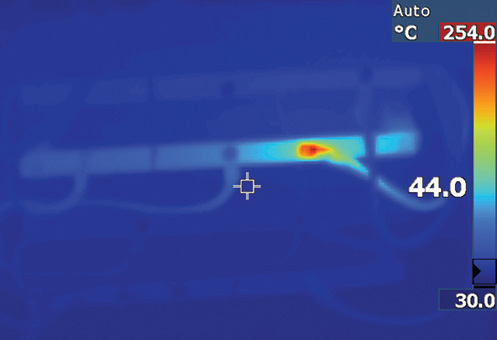
▲Figure 2. The high temperature at a connection in this three-phase junction box indicates an electrical fault.
Infrared thermography can be used to locate major electrical faults. For example, under normal conditions, the temperatures (which correspond to phase) of all three electrical inputs to a three-phase junction box are typically the same. If a fault exists in one or more phases, it will likely be accompanied by an abnormal rise in temperature at the faulty connection (Figure 2).
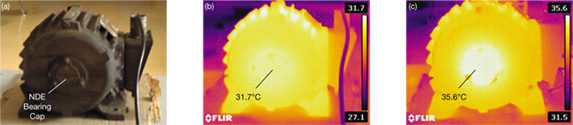
▲Figure 3. An external temperature rise at the nondrive end (NDE) bearing cap of a motor (a) can be detected by comparing normal (b) and abnormal (c) thermographic images. Temperature changes could indicate a problem.
Faults in the bearings of rotating machinery can lead to huge economic losses, so they require timely detection. Figure 3 compares thermal images of a motor’s nondrive end (NDE) bearing cap (Figure 3a). Figure 3b shows the normal temperature profile of the healthy motor. The white spot in the center of Figure 3c is evidence of an abnormally high temperature.
Regularly monitoring the temperature of critical components and looking for sudden abnormal temperature increases can be useful in detecting the onset of potential faults.
Infrared thermography offers several advantages. It provides noncontact online, continuous, and real-time monitoring, and it can be applied to a wide variety of applications (e.g., electrical faults, mechanical inaccuracies, insulation problems, leaks). However, infrared cameras are considerably more costly than some other measurement devices. (Editor’s Note: Read the January 2017 CEP article “Use Thermography to Expose What’s Hidden,” pp. 21–27, for more examples of thermographic troubleshooting.)
Dynamic monitoring
Dynamic monitoring schemes measure and analyze the energy released from mechanical processes in the form of waves, such as vibrations, pulses, and acoustic effects. The frequencies of these vibrations are directly related to the geometry and condition of equipment or processes. Any changes in dynamic characteristics can be precursors of imbalance, misalignment, resonance, structural failures, bearing faults, or other developing problems.
Vibration signature analysis. Every operating machine produces a characteristic signature of vibrations, which should not change over time. However, when a structural or functional anomaly progresses, the dynamic characteristics of the machine change and are reflected in its vibration signature. The nature of a developing fault has unique vibration characteristics, which can be compared with the vibration signature of the equipment under normal operating conditions. Various signal analysis techniques can be used to determine the category or type of fault.
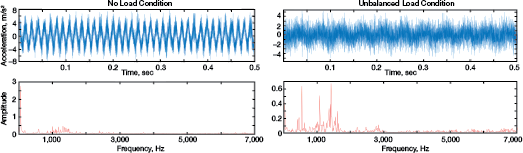
▲Figure 4. The addition of an unbalanced load to a synchronous generator altered the vibration signal profile, indicating a loose foundation.
Vibration of a machine can be represented (Figure 4) in a time domain (top) or in a frequency domain (bottom). Vibration signals of rotary machine systems, such as machine tools, wind turbines, and electric motors, can be broadly classified as stationary or nonstationary. Stationary signals are characterized by time-invariant statistical properties such as periodic vibrations (caused by, for example, a worn bearing), and they can be analyzed by simple techniques such as a Fourier transform. Nonstationary signals are transient, with durations generally shorter than the observation interval. Nonstationary signals are generated by faults such as sudden breakage of a drill bit, flaking of the raceway of a rolling bearing, or the growth of a crack. Analysis of nonstationary vibration signals is conducted using time-frequency techniques, such as a short-time Fourier transform (STFT), wavelength transform, and Hilbert-Huang transform (HHT).
Acoustic emission testing. Acoustic emission testing (AET) is used to analyze sound wave emissions caused by defects or discontinuities. These acoustic emissions are transient elastic waves induced by a rapid release of strain energy caused by small deformations, corrosion, or cracking that occur prior to structure failure. In general, faults that generate such emissions include impact, cyclic fatigue, friction, turbulence, material loss, cavitation, and leakage.
Acoustic emissions propagate on the surface of a material as Rayleigh waves. Sensors (which are almost always a piezoelectric crystal commonly made from ceramics) measure the displacement of these waves. The characteristics of the signal vary and depend on the distance between the sensor and the discontinuity. By analyzing the signal characteristics, it is possible to ascertain the defect position and suspect area of the structure.
Data analysis can be done by a parameter or waveform approach. In parameter-based analysis, only some of the parameters of the acoustic emission signal are recorded, but the signal itself is not recorded; this minimizes the amount of data that needs to be stored and enables faster analysis. In waveform analysis, the complete waveform is analyzed (rather than only some of the signal’s parameters), which allows the data to be interpreted more easily than parameter-based approaches. Waveform analysis enables the use of modern signal processing methods and provides better noise discrimination.
Ultrasonic condition monitoring. Ultrasonic condition monitoring uses contact or noncontact ultrasound instruments to collect high-frequency ultrasonic emissions produced by operating equipment, electrical emissions, and leaks. Transducers electronically translate ultrasound frequencies (above 20,000 Hz) to the audible range (20–20,000 Hz), while maintaining the sound quality during the transition through a process called heterodyning. Signals can then be analyzed at observable intensities.
Ultrasound monitoring is implemented in both passive and active forms. Passive monitoring can be used to detect airborne or structure-borne emissions produced by the component of interest to identify faults, such as bearing faults, lubrication issues, gear damage, pump cavitation, and leaks. In an active ultrasound approach, a precisely guided beam of ultrasound is transmitted to the object of interest to detect both surface and subsurface discontinuities like delaminations, disbonding, cracks, and early-stage porosity. The wave interacts with the structural discontinuity, causing reflection or scattering of the guided waves that is measured as transmission loss. Transmission losses are mapped over the entire test structure to determine the location of the fault.
Oil monitoring
Oil is used in almost every electrical machine and mechanical process for lubrication, hydraulics, or electrical insulation. Oil can serve as an important source of information for detecting early faults. Oils can be analyzed to determine condition, contamination, and machine wear to uncover problems such as degradation, contamination, and deterioration.
Fluid property analysis evaluates the fluid viscosity, additive level, oxidation properties, and specific gravity, while fluid contamination analysis evaluates the sample for moisture, metallic particles, coolant, and air. These techniques provide a profile of the oil’s condition for determining whether the oil has deteriorated such that it can no longer fulfill its primary function of reducing friction and preventing wear. Wear debris analysis determines the debris content of the sample. Equipment wear creates particulate debris in the oil, which can be detected and analyzed to identify the worn components and the extent of damage.
Closing thoughts
Table 2 summarizes some common components and indicates suitable condition monitoring techniques. Temperature, dynamic, and oil monitoring are the most commonly used methods of condition monitoring. However, specialized techniques, such as X-ray radiography, liquid dye penetrant analysis, and magnetic particle inspection, are also used. Often a combination of complementary sensing techniques is used to monitor the health of equipment or processes.
| Table 2. The type of condition monitoring technique employed depends on the component to be monitored. | ||||||
| Component | Failure | Thermal Imaging | Ultrasound Monitoring | Vibration Analysis | Acoustic Emission | Oil Monitoring |
| Pumps | Cavitation | ✔ | ✔ | ✔ | ||
| Pipes | Cavitation | ✔ | ||||
| Steam Pipes | Leaks | ✔ | ✔ | ✔ | ||
| Surge Arrester | Failure | ✔ | ||||
| Rotor Bar | Broken rotor | ✔ | ✔ | ✔ | ||
| Transformer | Insulation defect | ✔ | ✔ | ✔ | ||
| Bearing | Wear | ✔ | ✔ | ✔ | ✔ | ✔ |
| High-Voltage Equipment | Corona discharge | ✔ | ✔ | |||
| Gear Train | Gearbox failure | ✔ | ✔ | ✔ | ||
Advances in technology and computing capabilities have enabled artificial intelligence-based models. These models are better able to analyze the vast amounts of available sensor data, improving equipment monitoring and helping to prevent faults and failures.
Additional Reading
American Bureau of Shipping, “Guidance Notes on Equipment Condition Monitoring Techniques,” AMS, Houston, TX (Apr. 2016).
Bagavathiappan, S., et al., “Infrared Thermography for Condition Monitoring — A Review,” Infrared Physics and Technology, 60, pp. 35–55 (Sept. 2013).
Han, Y., and Y. H. Song, “Condition Monitoring Techniques for Electrical Equipment: A Literature Survey,” Institute of Electrical and Electronics Engineers (IEEE) Power Engineering Review,22 (9), p. 59 (Sept. 2002).
International Atomic Energy Agency, “Implementation Strategies and Tools for Condition Based Maintenance at Nuclear Power Plants,” IAEA, Vienna, Austria (May 2007).
Jadin, M. S., and S. Taib, “Recent Progress in Diagnosing the Reliability of Electrical Equipment by Using Infrared Thermography,” Infrared Physics and Technology,55 (4), pp. 236–245 (July 2012).
Lu, B., “A Review of Recent Advances in Wind Turbine Condition Monitoring and Fault Diagnosis,” Institute of Electrical and Electronics Engineers (IEEE) Power Electronics and Machines in Wind Applications, pp. 1–7 (2009).
Qu, Y., et al., “Gearbox Tooth Cut Fault Diagnostics Using Acoustic Emission and Vibration Sensors — A Comparative Study,” Sensors,14 (1), pp. 1372–1393 (2014).
Sethiya, S. K., “Condition Based Maintenance (CBM),” Indian Railways Service of Mechanical Engineers, http://irsme.nic.in/files/cbm-sethiya.pdf (2005).
1

Copyright Permissions
Would you like to reuse content from CEP Magazine? It’s easy to request permission to reuse content. Simply click here to connect instantly to licensing services, where you can choose from a list of options regarding how you would like to reuse the desired content and complete the transaction.